The German DIN33430 – Analysis of acceptance with R
The german DIN33430 defines quality standards that must be met in „job-related proficiency assessments“, the qualifications of the responsible parties involved, as well as the creation, execution and evaluation of such assessments.
Licensed persons are published on a website (german). I am interested in the status quo of licensing. Is the (no longer new) standard accepted by the german practitioners?
I use the XML package (readHTMLTable) to import the data from html tables in R.
library(XML)
din33430aurl <- "http://www.din33430portal.de/registerneu.php?tabelle=liz_a&action=update&sort=Name&limit=1000&limitstart=0"
din33430meurl <- "http://www.din33430portal.de/registerneu.php?tabelle=liz_me&action=update&sort=Name&limit=1000&limitstart=0"
din33430a <- as.data.frame(readHTMLTable(din33430aurl))
din33430me <- as.data.frame(readHTMLTable(din33430meurl))
Next I would like to know where the license holders live. I discovered a cool tab-delimited table (read.delim) with information on location, ZIP code and latitude and longitude. I use this information later to visualize the license holders on a map of Germany.
plzurl <- "http://fa-technik.adfc.de/code/opengeodb/PLZ.tab"
plz <- read.delim(plzurl)
The map data I receive from gadm.org. Even in .RDATA format!
con <- url("https://gadm.org/data/rda/DEU_adm1.RData")
print(load(con))
close(con)
Before I can plot my geodata, I must merge my data sets.
din33430a <- merge(din33430a, plz, by.x="NULL.PLZ", by.y="plz")
din33430me <- merge(din33430me, plz, by.x="NULL.PLZ", by.y="plz")
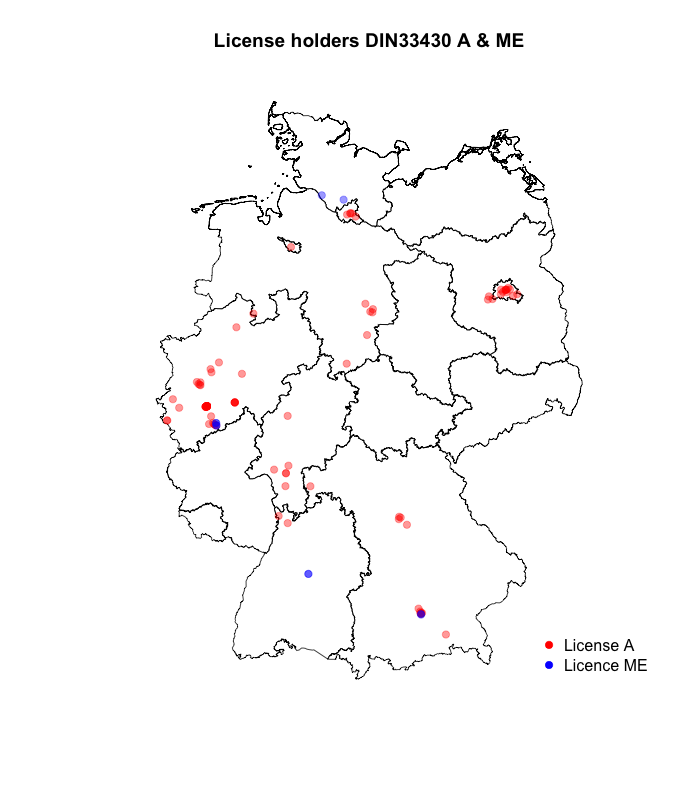
Now I can see where the license holders are stationed in Germany. I use transparency, so that overlaid points remain distinguishable. Most live in Cologne, by the way (24 people).
plot(gadm) #ggf. titel entfernen
title("License holders DIN33430 A & ME")
points(din33430a$lon,din33430a$lat, pch=19, col = rgb(red=1, blue=0, green=0, alpha=0.4))
points(din33430me$lon,din33430me$lat, pch=19, col = rgb(red=0, blue=1, green=0, alpha=0.4))
legend(14, 48, c("License A", "Licence ME"), pch= c(19, 19), col=c("red", "blue"), bty="n")
din33430 <- rbind(din33430a,din33430me)
par(las=2) # make label text perpendicular to axis
par(mar=c(5,12,4,5)) # increase y-axis margin
daten <- as.data.frame(table(factor(din33430$Ort)))
daten <- daten[order(-daten$Freq) , ]
barplot(height=daten$Freq, names.arg=daten$Var1, horiz=TRUE, cex.names=0.8)
title("Cologne is the city, where the Din33430-License holders come from!")

Finally, we look more to the companies that license their employees. The most active company is the "Cologne Institute for Management Consulting". However, companies do appear several times because of spelling mistakes. Look yourself ..
par(las=2) # make label text perpendicular to axis
par(mar=c(5,20,4,5)) # increase y-axis margin
daten2 <- as.data.frame(table(factor(din33430$NULL.Organisation)))
daten2 <- daten2[order(daten2$Freq) , ]
barplot(height=daten2$Freq, names.arg=daten2$Var1, horiz=TRUE, cex.names=0.6)
title("Din33430: Most active companies")

Oh, and to answer my own question: It does not look as if the DIN33430 standard is accepted in practice! The German market for personal diagnosis is in fact much larger. What do you think?
___
Bildquelle: OpenAI. (2024). DIN33430 [Digital image created with DALL-E]. Retrieved from https://openai.com/