The ‚R‘ in Human [R]esources (or: a very brief introduction to the statistical package ‚R‘ for HR)
I studied psychology in Marburg (Germany). At university we exclusively used SPSS. The courses were among my classmates usually not the most popular. After over 10 years in management consulting, I have noticed that little has changed to this. It’s a shame because a lot of interesting data in consulting firms and HR departments remain unused.
In my role as managing director of kibit GmbH, I have placed the focus of the company on „R“ (instead of SPSS). We use R e.g. for the evaluation of employee surveys and 360 degree feedback. In particular, the possibilities of automation, the outstanding graphical capabilities and the reproducibility of our work have been decisive. Meanwhile, we have changed to RStudio as a graphical development environment (GUI).
Here in my blog I will publish in the future at irregular intervals interesting code examples (with links to HR). Perhaps some readers feel encouraged to give R a try. Well, if so, what should they do?
R is available for Mac, Windows and Linux. Installation is not complicated. When you first launch RStudio, you will be greeted by an interface that looks similar to this:
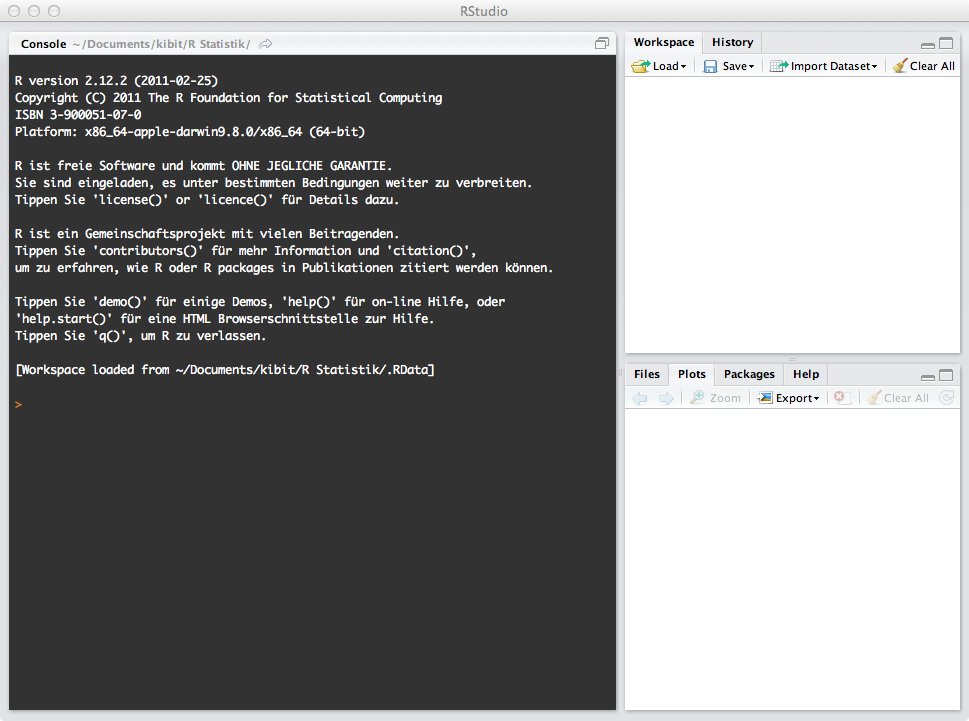
Screenshot: RStudio
R is a programming language. As with other languages, also applies here: practice makes perfect. I personally think the website Quick-R, and this manual are good points to start.
Just to show, how easy it is, please open a new window (File -> New -> R script) and copy the following code into it. Then select everything (Ctrl-A) and press the run button.
assessors <- c(8, 10, 8, 5, 4, 7, 10, 6)
names(assessors) <- c("Fischer", "Miller", "Mayer", "Master", "Hunter", "Smith", "Kim", "Baker")
barplot(sort(assessors, decreasing = TRUE), main = "assessment center per year", col = hcl(h = seq(0, 240, by = 30)), horiz = TRUE, las=1)
In line 1 we define eight values, which we assign certain people in line 2. The third line generates the graph. If all goes well, we get the following result:
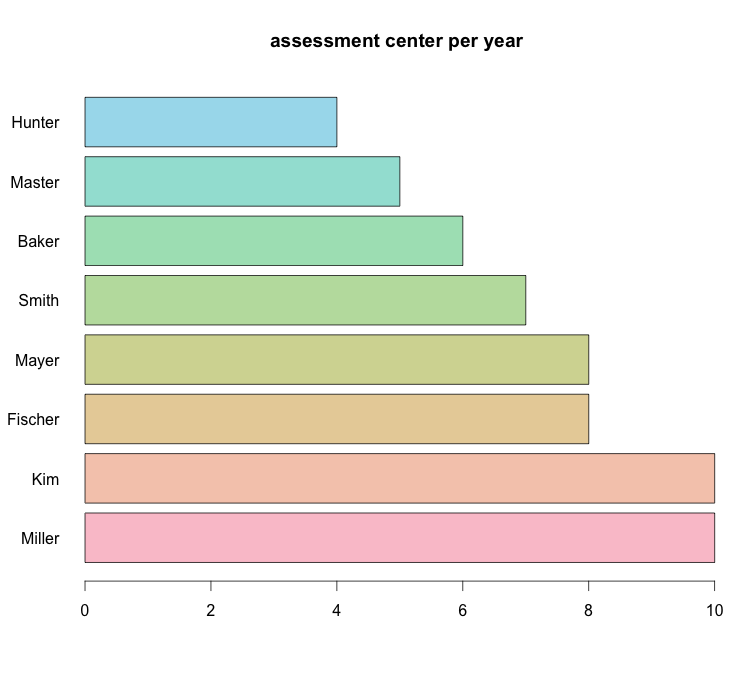
AC per year